Exploratory to Explanatory
- Lauren Avero

- Aug 19, 2019
- 2 min read
These next weeks is the transition form the exploratory to the explanatory stage. The process means to begin looking at understanding our data more deeply this will involve
Comparing categorical values
Assessing hierarchies and part-of-a-whole relationships
Showing changes over time
Mapping geo-spatial data
Charting and graphing relationships
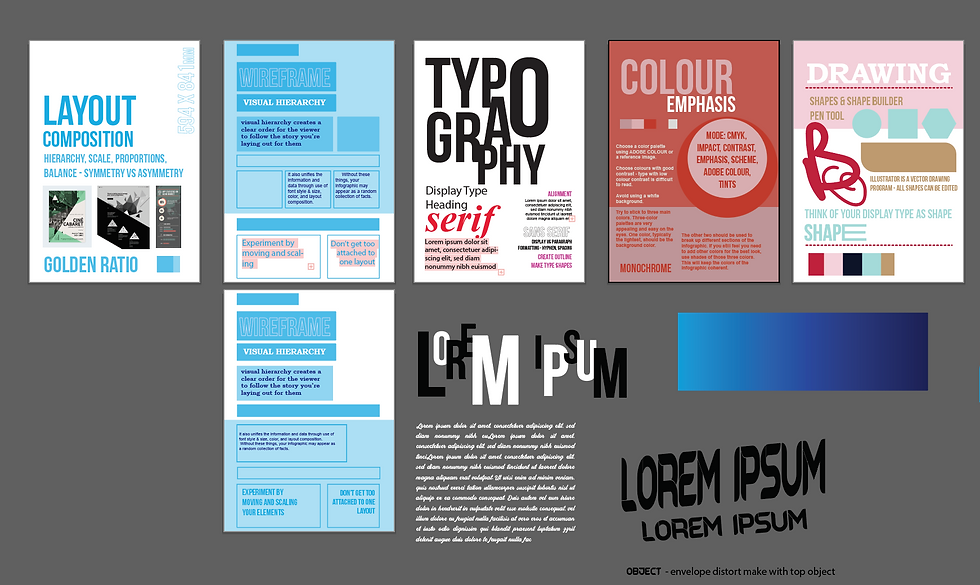
Using this process we'll begin to create an understanding of our how our graphics within the poster will convey our data accurately and visually aesthetic. These to concepts will meet in the middle in its simplest definition creating a poster that will educate its readers of the topic. With this a few experiments were done through Excel and Illustrator graphs. I have a personal preference to not use excel where I can as its proves extremely frustrating however in this instance it was quite useful in regards to inputting data. Using illustrator I created a few examples of graphs using different tools such as extrude, changing the colours and labelling the categories, it was a simple minimal test to investigate the tools avaliable for the process of creating our data visuals.

During the studio practice we were led in a tutorial practice of the principles of design this practical based help was really helpful in understanding the software whilst also forward thinking about the principles needed in our posters.

With both these aspects in mind it is important whilst making the poster that I prioritise the narrative of the infographic whilst using graphics to only enhance this information.
"PEN TO PAPER IS WHAT GETS THE CREATIVE JUICES GOING"
This meant that the first steps of the creation of the poster relied on:
Brainstorming
Mind-mapping
Thumbnails
Sketches (Roughs)
Wireframes
Investing in a Rhodia sketch pad I was able to create a few examples of what the poster may take form as to get an idea into what graphs I will potentially use. Whilst having all the information in a document I created examples of the potential graphics in the poster.
In the next week I will have an idea onto what I will include in the poster then moving onto the stages of 'Select, Implement and Learn' stages.
Until Next Time, Live and Laugh,


Comments